Lineare Regression
Contents
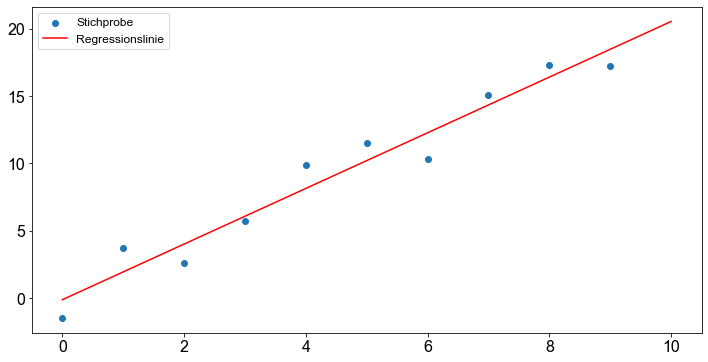
Lineare Regression
Führen Sie eine lineare Regression für die folgenden Daten (
x,y) durch und stellen Sie die Regressionsgerade und die Daten graphisch dar.
import numpy as np

n = 10
noise = np.random.normal(0, 1.4, n)
x = np.arange(0, n, 1)
y = 2 * x + noise
# Frage 1 ...
Lösungen
import matplotlib.pyplot as plt
import statsmodels.api as sm

fig, ax = plt.subplots()
ax.scatter(x, y, label="Stichprobe")

# Fitte das Modell
model = sm.OLS(y, sm.add_constant(x)).fit()
x_axis = np.linspace(0, n, 100)
reg_line = model.predict(sm.add_constant(x_axis))
ax.plot(x_axis, reg_line, color="red", label="Regressionslinie")
ax.legend()
plt.show()