Einfaches logistisches Regressionsmodell
Contents
Einfaches logistisches Regressionsmodell
Erstellen Sie ein einfaches logistische Regressionsmodell für die folgenden Daten in Python und stellen Sie das logistische Modell graphisch dar.
x = [
    29,
    15,
    33,
    28,
    39,
    44,
    31,
    19,
    9,
    24,
    32,
    31,
    37,
    35,
    8,
    4,
    11,
    12,
    33,
    45,
    20,
    25,
    27,
    26,
    29,
]
y = [0, 0, 1, 1, 1, 1, 1, 0, 1, 0, 0, 0, 1, 1, 0, 0, 0, 0, 1, 1, 0, 1, 1, 1, 1]
Lösungen
import matplotlib.pyplot as plt
import numpy as np
import statsmodels.api as sm
log_model = sm.GLM(y, sm.add_constant(x), family=sm.families.Binomial())
log_results = log_model.fit()
x_axis = np.linspace(min(x), max(x), num=100)
predictions = log_results.get_prediction(exog=sm.add_constant(x_axis)).summary_frame()
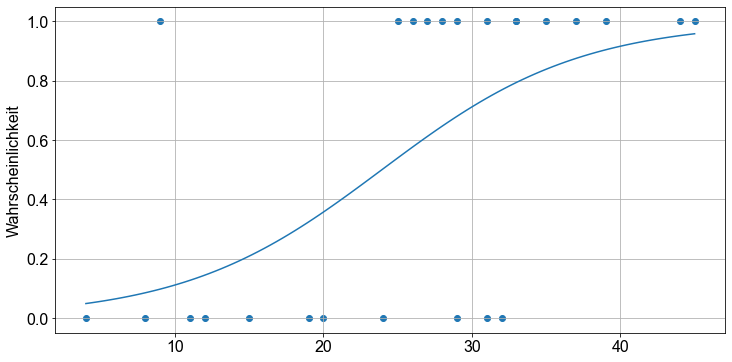
fig, ax = plt.subplots()
ax.scatter(x, y)
ax.plot(x_axis, predictions["mean"])
ax.grid()
ax.set_ylabel("Wahrscheinlichkeit")
plt.show()