Polynomiale Regression
Contents
Polynomiale Regression
Führen Sie eine polynomiale Regression \(2\)-ten Grades für die folgenden Daten (
x,y) durch und stellen Sie die Regressionsgerade und die Daten graphisch dar.
import numpy as np
import matplotlib.pyplot as plt
x = np.array([0, 1, 2, 3, 4, 5, 6, 7, 8, 9, 10])
y = np.array([1, 6, 17, 34, 57, 86, 121, 162, 209, 262, 321])
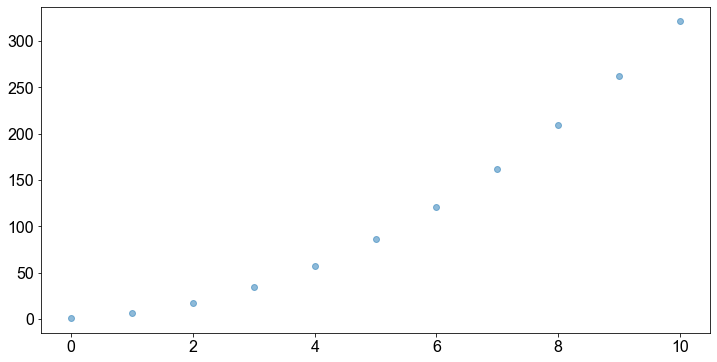
fig, ax = plt.subplots()
ax.scatter(
x,
y,
alpha=0.5,
)
plt.show()
# Frage 1 ...
Lösungen
import matplotlib.pyplot as plt
import numpy as np
from sklearn.linear_model import LinearRegression
from sklearn.preprocessing import PolynomialFeatures
X = x.reshape(-1, 1)
y = y.reshape(-1, 1)
poly = PolynomialFeatures(degree=2)
X_2 = poly.fit_transform(X)
model = LinearRegression()
model.fit(X_2, y)
xaxis = np.linspace(0, 10, 100)
xaxis_2 = poly.transform(xaxis.reshape(-1, 1))
reg_line = model.predict(xaxis_2)
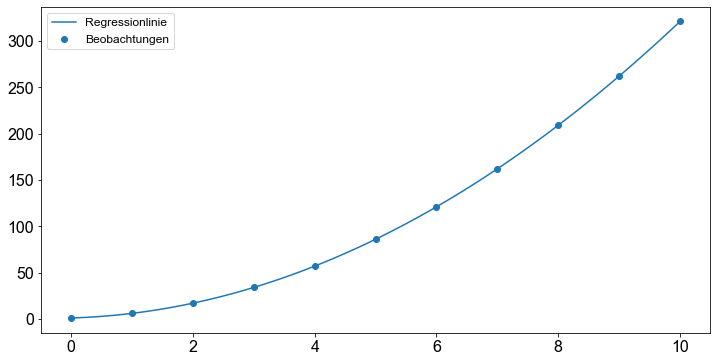
fig, ax = plt.subplots()
ax.plot(xaxis, reg_line, label="Regressionlinie")
ax.scatter(x=X, y=y, label="Beobachtungen")
ax.legend()
plt.show()